Cloud Server Monitoring and Alerting: Don’t Wait for Users to Tell You It’s Down
One Friday afternoon last year, a client's database disk filled up. The entire business ground to a halt. But no alert fired — the threshold was set to 90%, and the disk went from 85% to 100% in under an hour. The operations team only found out when users started calling.
"The monitoring is there, right?" they asked.
Yes, monitoring was there — but the alerts weren't tuned correctly.
01 Why Alerting Matters
In cloud-native architectures, applications are composed of hundreds of microservices and instances. Operations teams can't manually monitor every dashboard around the clock. Alerts turn scattered monitoring data into actionable events, shifting operations from reactive firefighting to proactive risk management .
Monitoring without alerting is like having a fire alarm that doesn't make a sound. Monitoring tells you "what's happening now." Alerting tells you "you need to act now."
02 What Metrics Deserve Alerts?
Not every metric needs an alert, but these categories must be covered.
System‑level metrics:
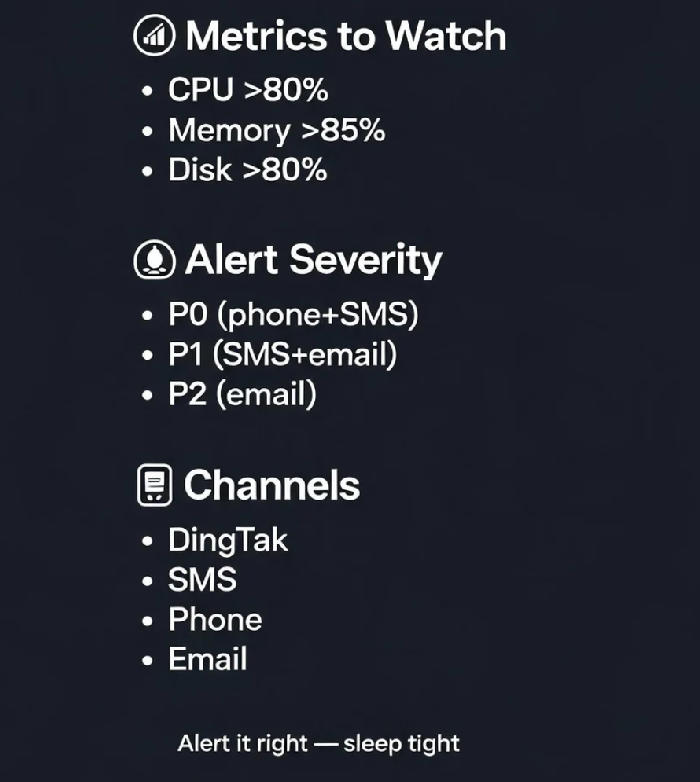
CPU utilisation – alert when sustained >80%
Memory utilisation – alert when sustained >85%
Disk utilisation – 80% for warning, 90% for critical. A disk can fill up faster than you expect.
Network bandwidth – alert when nearing the limit
Cloud provider monitoring agents support collecting over 40 metrics including CPU, memory, disk, and network, with data collection frequency as low as one minute .
Reference alert thresholds:
CPU usage: 70% alert threshold, triggered after three consecutive breaches
RDS CPU usage: 70% alert threshold
Disk usage: 80% warning, 90% critical
03 Alert Severity Levels
Alerts without severity levels are just noise. Different levels need different response expectations and notification channels .
| Level | Definition | Response Time | Notification |
|---|---|---|---|
| P0 (Critical) | Service unavailable | Immediate | Phone + SMS |
| P1 (Important) | Performance degradation | Fast response | SMS + Email |
| P2 (Notice) | Resource warning | Business hours |
04 Configuration Steps
1. Install the monitoring agent
Basic cloud monitoring runs automatically, but OS‑level metrics like memory and disk I/O require an agent for collection. With the agent, data collection frequency improves from 5 minutes to 1 minute, catching anomalies much earlier.
2. Create alert rules
In the cloud monitoring console, select target resources and set alert rules. Multiple notification channels are supported: SMS, email, phone calls, WeChat, DingTalk, and others .
3. Configure notification channels
Different severity levels should use different channels: P0 uses phone + SMS, P1 uses SMS + email, P2 uses email.
The Bottom Line
That client later reconfigured their alert rules: disk usage at 80% for warning, 90% for critical, CPU >80% sustained for 5 minutes, and integrated with DingTalk for notifications. The next time disk writes spiked, they received the alert 2 hours in advance and expanded capacity without any service interruption.
Spending half an hour tuning alerts saves you from being woken up at 3 AM. Are your server monitoring alerts properly set up?