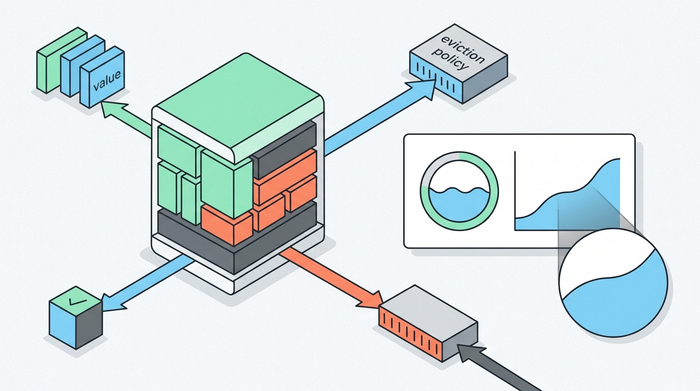
 Redis memory growth does not always mean that the dataset is leaking. The database may genuinely contain more keys, expired data may not be disappearing as expected, the allocator may be holding fragmented pages, or background persistence and replication may be creating temporary overhead. Treating all of these cases as “a big key problem” often leads to the wrong fix.
This guide provides a production-oriented investigation order for Redis on Linux. It explains how to distinguish dataset growth from RSS growth, how to review TTL and eviction behavior, and how to account for fragmentation, clients, replication, RDB snapshots, and AOF rewrites before changing configuration.
Documentation checked on September 15, 2026. Command output and available metrics can vary by Redis version and managed-service restrictions. Verify the documentation for your deployed version before changing a production instance.
1. Establish which memory number is growing
Start with Redis itself instead of relying only on top, free, or a container dashboard:
redis-cli INFO memory
redis-cli MEMORY STATS
The first comparison is between these metrics:
used_memory: memory allocated by Redis through its allocator.used_memory_dataset: the portion associated with the dataset after internal overhead is removed.used_memory_rss: physical memory attributed to the Redis process by the operating system.mem_fragmentation_ratio: the relationship between RSS and allocated memory.maxmemory: the configured memory limit;0normally means no explicit Redis limit on a 64-bit system.mem_not_counted_for_evict: memory excluded from eviction calculations, including certain replication and AOF buffers.
Interpret the trend, not a single ratio. If used_memory_dataset, key count, and write volume rise together, the dataset is probably growing. If used_memory stabilizes but RSS remains much higher, fragmentation or allocator retention is more likely. If memory jumps during BGSAVE or BGREWRITEAOF, copy-on-write overhead needs attention.
Record a baseline before making changes:
date
redis-cli INFO memory
redis-cli INFO keyspace
redis-cli INFO persistence
redis-cli INFO replication
redis-cli INFO clients
Taking the same snapshot every few minutes during the incident is more useful than comparing unrelated dashboard peaks.
2. Check whether the keyspace is actually expanding
Count keys and inspect database-level TTL statistics:
redis-cli DBSIZE
redis-cli INFO keyspace
For each database, INFO keyspace reports keys, expires, and an average TTL sample. A rapidly increasing key count with a small expires value is a strong sign that cache entries are being written without a lifetime. A stable key count with rising memory suggests that existing values may be getting larger.
Use Redis CLI sampling tools during a low-traffic period:
redis-cli --bigkeys -i 0.1
redis-cli --memkeys -i 0.1
These scans traverse the keyspace. The -i delay reduces pressure but does not make a full scan free. On a busy or very large production database, test the command on a replica or run it with strict operational monitoring.
For a suspected key, inspect its size and encoding:
redis-cli MEMORY USAGE app:session:123 SAMPLES 5
redis-cli TYPE app:session:123
redis-cli OBJECT ENCODING app:session:123
redis-cli PTTL app:session:123
Avoid KEYS * in production. Use cursor-based SCAN when you need application-specific sampling, and do not delete a large collection synchronously without understanding the latency impact. UNLINK can move much of the reclamation work off the main thread, but the command still changes live data and should follow an approved cleanup plan.
3. Review TTL behavior before changing eviction
Expiration and eviction solve different problems. Expiration removes a key after its TTL. Eviction selects keys when Redis reaches maxmemory and a command needs more memory.
Check representative keys from each namespace:
redis-cli PTTL cache:product:1001
redis-cli PTTL session:9f82
redis-cli PTTL rate-limit:203.0.113.8
Typical warning signs include:
cache-writing code paths that omit
EX,PX,EXAT, orPXAT;refresh jobs that replace values and accidentally remove or extend the intended TTL;
mixed persistent and expiring keys under a
volatile-*eviction policy;a burst of keys with nearly identical expiration times, creating an avoidable cleanup spike.
Fix TTL ownership in the application when possible. Retrofitting TTLs with a one-off script can be useful, but it is a data mutation and should be rate-limited, audited, and tested on a representative sample first.
4. Confirm the memory limit and eviction policy
Read the active configuration:
redis-cli CONFIG GET maxmemory
redis-cli CONFIG GET maxmemory-policy
redis-cli CONFIG GET maxmemory-samples
Common policies behave differently:
noevictionrejects memory-growing writes after the limit is reached. It is appropriate when Redis must not discard data automatically.allkeys-lruevicts approximately least-recently-used keys from the entire keyspace and is common for general caches.allkeys-lfufavors frequently accessed keys when request frequency is more useful than recent access.volatile-lru,volatile-lfu,volatile-random, andvolatile-ttlselect only keys with an expiration. If few keys have TTLs, they may provide little room to recover.allkeys-randomhas low selection overhead but does not preserve hot data deliberately.
Do not copy a policy from another environment without classifying the workload. An all-keys policy can delete persistent application state. A volatile-only policy can behave like noeviction when no eligible expiring keys remain.
Also check whether eviction is already occurring:
redis-cli INFO stats | grep -E 'evicted_keys|expired_keys|keyspace_hits|keyspace_misses'
Rising evicted_keys confirms pressure, but it is not automatically healthy. Correlate it with latency, miss rate, backend load, and application errors. A cache that avoids out-of-memory errors by continuously evicting useful data can still overload its origin database.
5. Diagnose fragmentation and allocator retention
A high mem_fragmentation_ratio is a clue, not a complete diagnosis. MEMORY STATS provides more detail, including allocator fragmentation, allocator RSS, and RSS overhead. Linux may keep pages assigned to the process even after Redis frees objects, so RSS does not always fall immediately with used_memory.
Run the built-in diagnosis and review active defragmentation settings:
redis-cli MEMORY DOCTOR
redis-cli CONFIG GET activedefrag
If the Redis build and service allow it, active defragmentation can gradually reorganize allocations. It consumes CPU, so enable or tune it only after measuring latency and fragmentation. Do not restart a primary merely to make RSS look smaller unless failover, persistence, and recovery time have been tested.
MEMORY PURGE asks the allocator to release reclaimable pages. It is best-effort, may have no visible effect, and should not be treated as a substitute for fixing the allocation pattern:
redis-cli MEMORY PURGE
Before using it in production, confirm allocator support and run it during a controlled window.
6. Account for RDB and AOF copy-on-write overhead
RDB snapshots and AOF rewrites normally fork a background process. Linux initially shares memory pages between parent and child. Pages modified while the child is working are copied, so a write-heavy workload can produce a large temporary memory peak even when the dataset is stable.
Inspect persistence and fork-related metrics:
redis-cli INFO persistence
redis-cli INFO stats | grep latest_fork_usec
Look for a memory rise that aligns with rdb_bgsave_in_progress or aof_rewrite_in_progress, and review the available copy-on-write metrics for your Redis version. A long-running snapshot, slow storage, or a high write rate increases the period in which pages can be copied.
Practical mitigations include reducing unnecessary write amplification, scheduling manual maintenance away from traffic peaks, improving storage throughput, and leaving enough host or container headroom for a fork. Disabling persistence changes the durability model and should never be used as a quick memory fix without a recovery design.
7. Inspect clients, replication, and buffers
Dataset memory is only part of the process footprint. Slow clients, Pub/Sub consumers, replica lag, replication backlog, and AOF buffers can all grow.
Check the relevant sections:
redis-cli INFO clients
redis-cli INFO replication
redis-cli CLIENT LIST
redis-cli MEMORY STATS
Pay attention to blocked clients, unusually large output buffers, replica disconnections, and a replica that cannot consume data as quickly as the primary produces it. Review client-output-buffer-limit before changing it. A limit that is too high permits more memory growth; one that is too low may disconnect legitimate slow consumers.
Remember that some buffer memory is excluded from maxmemory eviction accounting. This is why a process can approach the Linux or container limit even though used_memory appears to remain near the configured Redis ceiling.
8. Choose the fix based on the failure mode
Use evidence from the previous steps:
If keys and dataset memory grow: fix retention, TTLs, cardinality, or oversized values; then plan safe cleanup or capacity expansion.
If eviction cannot find eligible keys: choose a policy aligned with whether Redis is a cache or a durable data store, and correct TTL coverage.
If RSS stays high while dataset memory falls: investigate allocator fragmentation, deletion patterns, active defragmentation, and controlled maintenance.
If peaks coincide with persistence: reserve copy-on-write headroom and reduce the duration or write intensity of background operations.
If buffers grow: identify slow clients, replication lag, Pub/Sub backpressure, or AOF pressure before raising limits.
If the container is being killed: compare Redis metrics with cgroup limits and host memory; Redis cannot manage headroom it cannot see or is not configured to reserve.
Do not set maxmemory equal to the machine or container limit. Leave capacity for the operating system, allocator overhead, client and replication buffers, persistence copy-on-write, monitoring agents, and workload bursts. The correct margin depends on write rate, dataset shape, persistence mode, and failover design.
A compact production checklist
redis-cli INFO memory
redis-cli MEMORY STATS
redis-cli INFO keyspace
redis-cli INFO persistence
redis-cli INFO replication
redis-cli INFO clients
redis-cli INFO stats
redis-cli CONFIG GET maxmemory
redis-cli CONFIG GET maxmemory-policy
redis-cli MEMORY DOCTOR
Capture the outputs with timestamps, compare them with application deploys and traffic changes, and change one variable at a time. That makes it possible to distinguish a real leak from expected dataset growth or temporary operating overhead.
Conclusion
When Redis memory keeps growing, first separate dataset growth from process RSS. Then verify key count, value size, TTL coverage, maxmemory, and the eviction policy. If the dataset is stable, move on to fragmentation, persistence forks, client buffers, and replication. This sequence prevents risky configuration changes and makes the final decision—cleanup, policy adjustment, resharding, or capacity expansion—based on measurable evidence.
References
Redis documentation: INFO command — checked September 15, 2026
Redis documentation: MEMORY STATS — checked September 15, 2026
Redis documentation: Key eviction — checked September 15, 2026
Redis documentation: Memory optimization — checked September 15, 2026
Redis documentation: Redis persistence — checked September 15, 2026
Redis documentation: MEMORY DOCTOR — checked September 15, 2026